
We have enterprise-grade reporting and analytics built in to RecordMy. You can access reporting easily. Just click ‘Reporting’ from the left hand menu in your main dashboard.
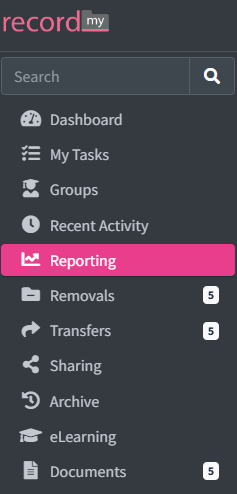
This will take you to the reporting page and here you can access a comprehensive range of reports to share within your teams or other stakeholders.
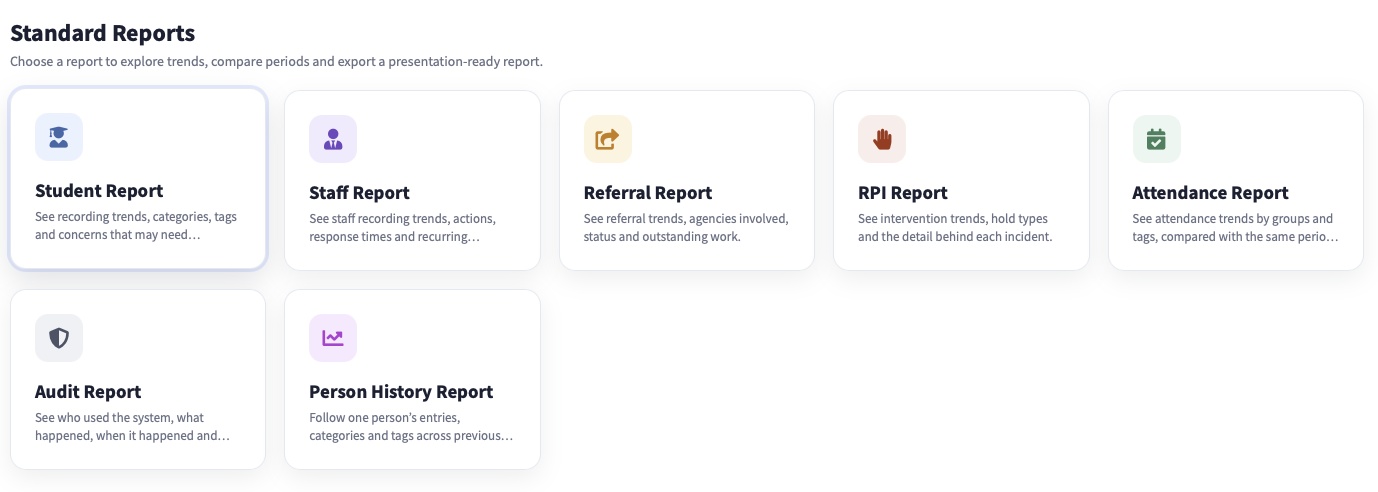
You can select the report type you want from the list of standard reports. Once selected you can change the dates or add filters.

How do I filter my report?
You can filter down as specifically as you require by clicking on any of the graphs or using the + Filter button at the top section of the page. With easily digestible graphs, bar charts and pie charts available to filter also, makes for a professional and understandable document in seconds.
For example; to change the reporting to only look at a particular ethnicity, click the corresponding segment on the graph. Again, once you do this it will appear in separate filters at the top of the screen and automatically update the other graphs.
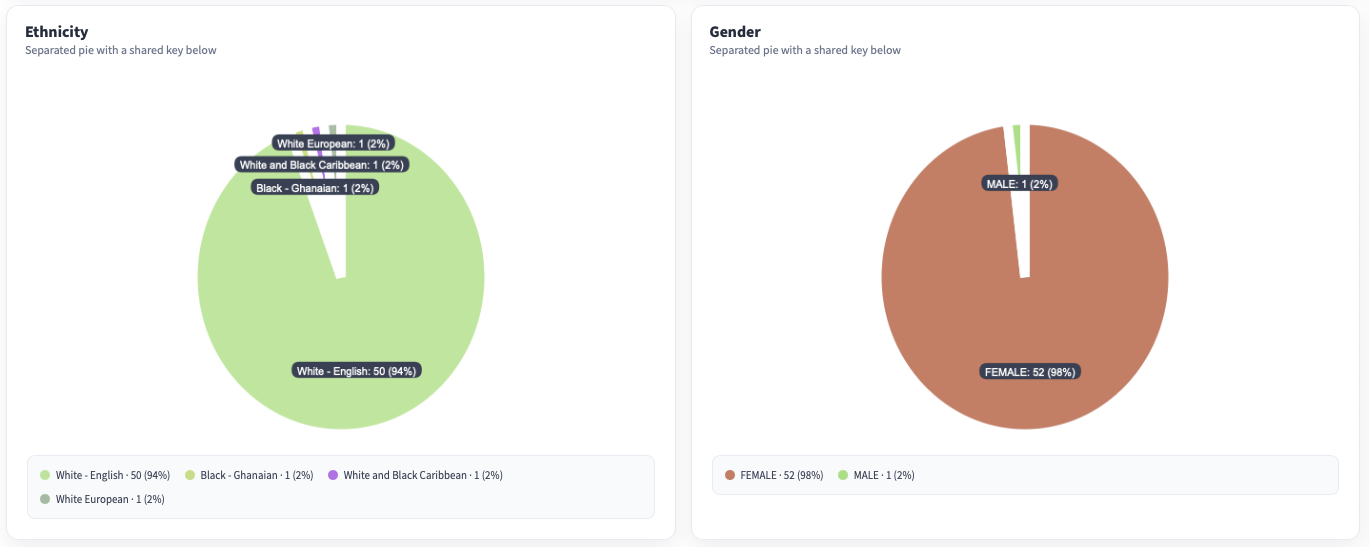
If you have a mistake or don’t want a particular filter selected, you can just click the 'x' next to the filters at the top to remove.

How do I change the dates?
To change the dates of the report there is a calendar in the top left hand corner of the filter section at the top of the report page. Simply select the dates you want, then click update report.
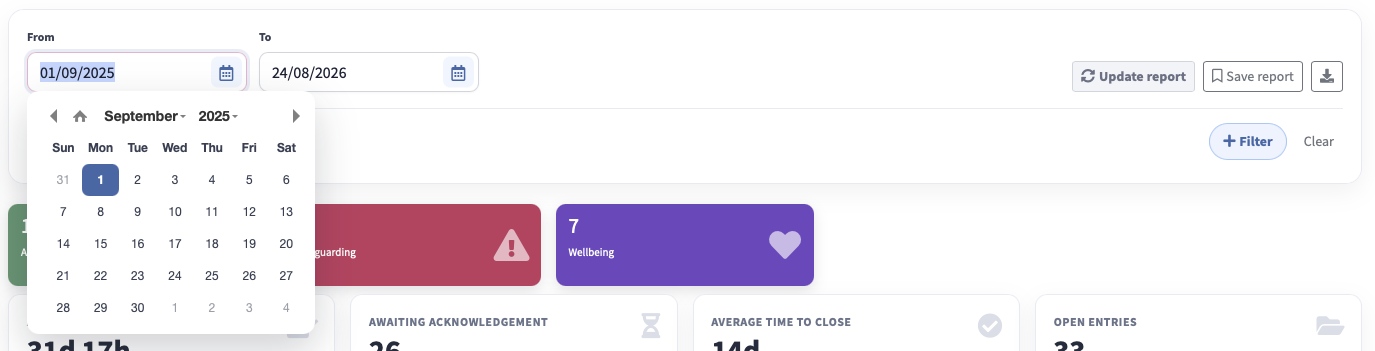
You can also download reports and save them for future use with any filters you have applied. There is a download button at the top and a 'Save report' button. When saving you will be asked for a name. Saved reports do not save the dates selected, only the filters applied. When you click a saved report it will ask what dates you would like to build the report against.